Portfolio project
Air Pollution & Ozone Monitoring
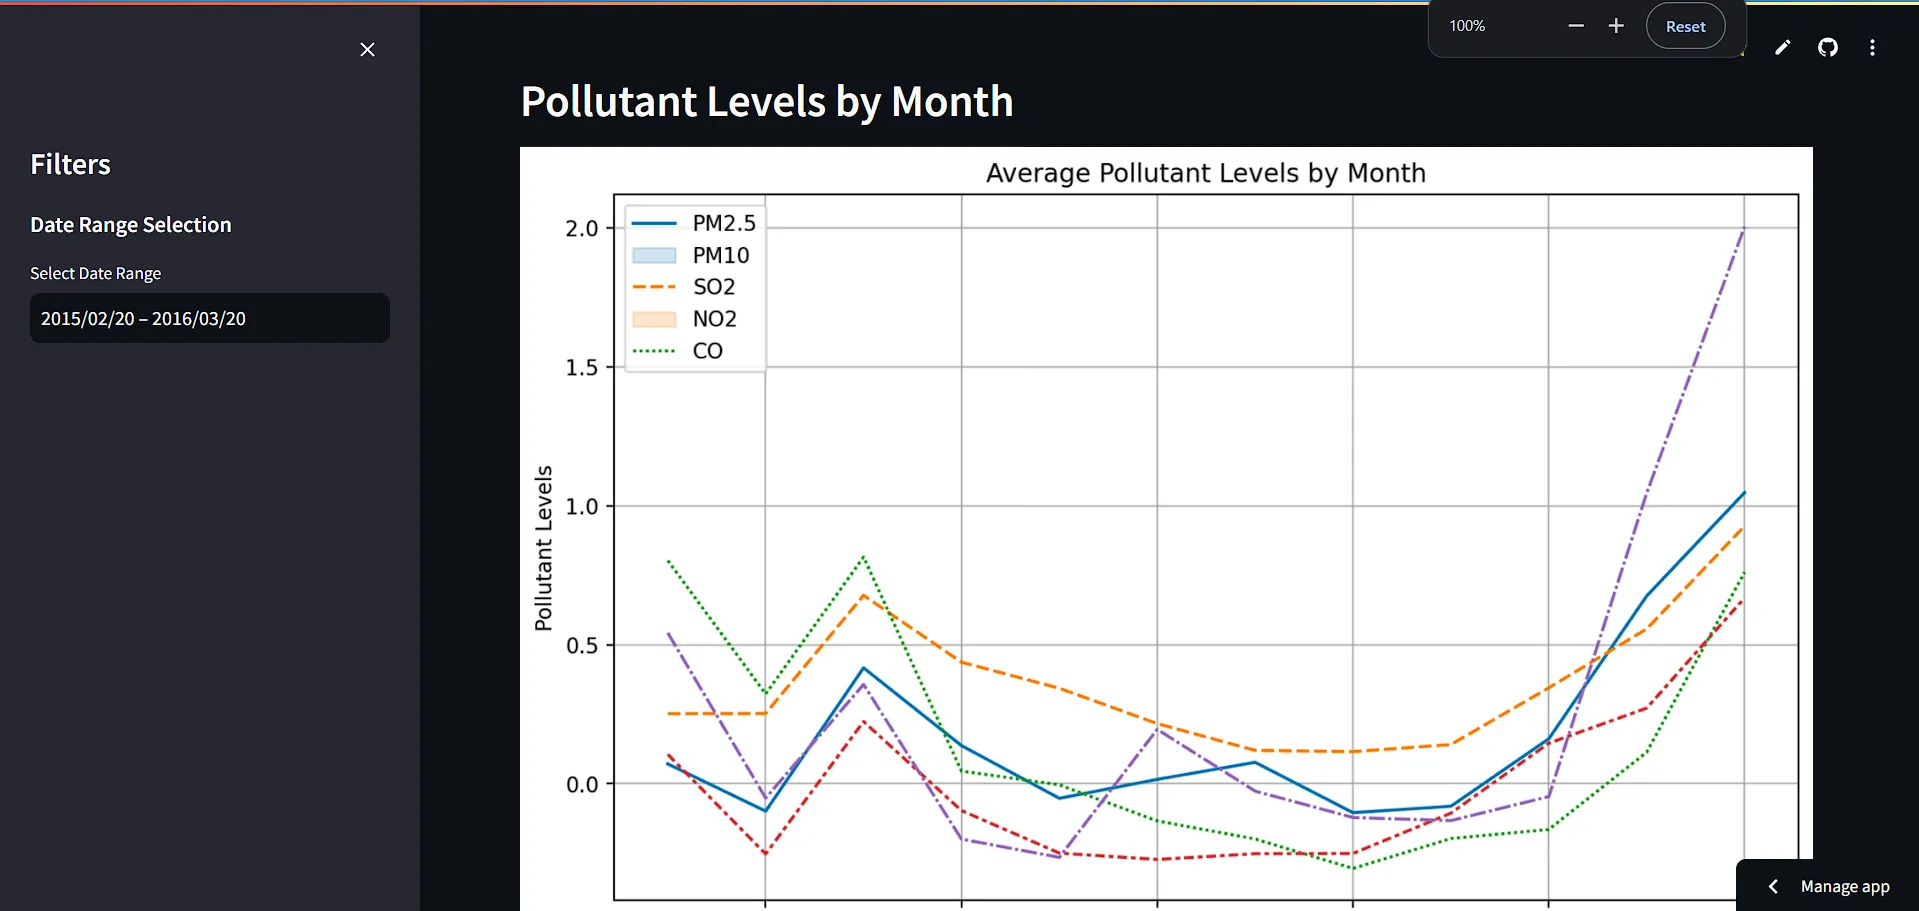
Built a Streamlit dashboard to monitor air quality and ozone levels, visualising pollutant trends by month and coordinating the full pipeline from data preprocessing to deployment.
- core technologies
- 4documented project stack
- project status
- Builtportfolio implementation
- delivery scope
- End-to-endfrom implementation to evaluation
01Problem
Built a Streamlit dashboard to monitor air quality and ozone levels, visualising pollutant trends by month and coordinating the full pipeline from data preprocessing to deployment.
02Approach
- Designed the solution using Python, Streamlit, Data Visualization.
- Implemented the core workflow and evaluated the result against the project objective.
- Documented the work as part of the broader AI and data portfolio.
03Contribution
- Contributed to technical implementation and project delivery.
- Worked across data preparation, modeling or application development as required by the project.
04Outcome
- Built a Streamlit dashboard to monitor air quality and ozone levels, visualising pollutant trends by month and coordinating the full pipeline from data preprocessing to deployment.
05Limitations
- Additional technical documentation will be added as the project archive is expanded.